昆明市城市化及城市热岛效应对植被净初级生产力的影响
English
-
参考文献
[1] IMHOFF M L, BOUNOUA L, DEFRIES R, LAERENCE W T, STUTZER D, TUCKER C J, RICHETTS T. The consequences of urban land transformation on net primary productivity in the United States. Remote Sensing of Environment, 2004, 89(4): 434-443. doi: 10.1016/j.rse.2003.10.015
[2] TIAN G J, QIAO Z. Assessing the impact of the urbanization process on net primary productivity in China in 1989–2000. Environmental Pollution, 2014, 184: 320-326. doi: 10.1016/j.envpol.2013.09.012
[3] WU S H, ZHOU S L, CHEN D X, WEI Z Q, DAI L, LI X G. Determining the contributions of urbanization and climate change to NPP variations over the last decade in the Yangtze River Delta, China. Science of The Total Environment, 2014, 472: 397-406. doi: 10.1016/j.scitotenv.2013.10.128
[4] VITOUSEK P M, MOONEY H A, LUBCHENCO J, MELILLO J M. Human domination of Earth’s ecosystems. Science, 2008, 277: 494-499.
[5] GREGG J W, JONES C G, DAWSON T E. Urbanization effects on tree growth in the vicinity of New York City. Nature, 2003, 424: 183-187. doi: 10.1038/nature01728
[6] CARREIRO M M, TRIPLER C E. Forest remnants along urban-rural gradients: Examining their potential for global change research. Ecosystems, 2005, 8(5): 568-582. doi: 10.1007/s10021-003-0172-6
[7] ZHOU D C, ZHAO S Q, ZHANG L X, LIU S G. Remotely sensed assessment of urbanization effects on vegetation phenology in China’s 32 major cities. Remote Sensing of Environment, 2016, 176: 272-281. doi: 10.1016/j.rse.2016.02.010
[8] YAN Y C, LIU X P, WANG F Y, LI X, OU J P, WEN Y Y, LIANG X. Assessing the impacts of urban sprawl on net primary productivity using fusion of Landsat and MODIS data. Science of The Total Environment, 2018, 613: 1417-1429.
[9] OKE T R. The micrometeorology of the urban forest. Philosophical Transactions of the Royal Society B: Biological Sciences, 1989, 324: 335-349.
[10] POTTER C S, RANDERSON J T, FIELD C B, MATSON P A, KLOOSTER S A. Terrestrial eco-system production: A process model based on global satellite and surface data. Global Biogeochemical Cycles, 1993, 7(4): 811-841. doi: 10.1029/93GB02725
[11] HARDIMAN B S, WANG J A, HUTYRA L R, GATELY C K, GETSON J M, FRIED M A. Accounting for urban biogenic fluxes in regional carbon budgets. Remote Sensing of Environment, 2017, 592: 366-372.
[12] FIELD C B, BEHRENFELD M J, RANDERSON J T, FALKOWSKI P. Primary production of the biosphere: integrating terrestrial and oceanic components. Science, 1998, 281: 237-240. doi: 10.1126/science.281.5374.237
[13] PIAO S L, FANG J Y, ZHOU L M, ZHU B, TAN K, TAO S. Changes in vegetation net primary productivity from 1982 to 1999 in China. Global Biogeochem Cycles, 2005, 19(2): 183-196.
[14] FANG Y, LI J, QING H. Quantitative assessment of the human appropriation of net primary production (HANPP) in the coastal areas of Jiangsu, China. Sustainability, 2015, 7(12): 15857-15870. doi: 10.3390/su71215793
[15] PIAO S L, FANG J Y, HE J S. Variations in vegetation net primary production in the Qinghai-Xizang Plateau, China, from 1982 to 1999. Climate Change, 2006, 74(1): 253-267.
[16] TIAN Y H, HUANG W L, WU X C, JIM C Y, LIU Y Q. Dominant control of climate variations over land-use change on net primary productivity under different urbanization intensities in Beijing, China. Acta Ecologica Sinica, 2019, 39(5): 416-424. doi: 10.1016/j.chnaes.2019.07.002
[17] ZHAO S Q, LIU S G, ZHOU D C. Prevalent vegetation growth enhancement in urban environment. Proceedings of the National Academy of Sciences of the United States of America, 2016, 113(22): 6313-6318. doi: 10.1073/pnas.1602312113
[18] GUAN X B, SHEN H F, LI X H, GAN W X, ZHANG L P. A long-term and comprehensive assessment of the urbanization-induced impacts on vegetation net primary productivity. Science of The Total Environment, 2019, 669: 342-352. doi: 10.1016/j.scitotenv.2019.02.361
[19] BUYANTUYEV A, WU J. Urbanization alters spatiotemporal patterns of ecosystem primary production: A case study of the Phoenix metropolitan region, USA. Journal of Arid Environments, 2009, 73 (4–5): 512-520.
[20] JIA W X, ZHAO S Q, LIU S G. Vegetation growth enhancement in urban environments of the conterminous United States. Global Change Biology, 2018, 24(9): 4084-4094. doi: 10.1111/gcb.14317
[21] ZHONG J, LIU J F, JIAO L M, LIAN X H, XU Z B, ZHOU Z Z. Assessing the comprehensive impacts of different urbanization process on vegetation net primary productivity in Wuhan, China, from 1990 to 2020. Sustainable Cities and Society, 2021, 75: 103295. doi: 10.1016/j.scs.2021.103295
[22] LU X Y, CHEN X, ZHAO X L, LYU D J, ZHANG Y. Assessing the impact of land surface temperature on urban net primary productivity increment based on geographically weighted regression model. Scientific Reports, 2021, 11: 22282. doi: 10.1038/s41598-021-01757-7
[23] WANG S J, SHI C Y, FANG C L, FENG K S. Examining the spatial variations of determinants of energy-related CO2 emissions in China at the city level using Geographically Weighted Regression Model. Applied Energy, 2019, 235: 95-105. doi: 10.1016/j.apenergy.2018.10.083
[24] FOTHERINGHAM A S, BRUNSDON C, CHARLTON M. Geographically weighted regression: The analysis of spatially varying relationships. American Journal of Agricultural Economics, 2004, 86(2): 554-556. doi: 10.1111/j.0002-9092.2004.600_2.x
[25] KASHKI A, KARAMI M, ZANDI R, ROKI R. Evaluation of the effect of geographical parameters on the formation of the land surface temperature by applying OLS and GWR, A case study Shiraz City, Iran. Urban Climate, 2021, 37: 100832. doi: 10.1016/j.uclim.2021.100832
[26] XU B, XU L, XU R J, LUO L Q. Geographical analysis of CO2 emissions in China’s manufacturing industry: A geographically weighted regression model. Journal of Cleaner Production, 2017, 166: 628-640. doi: 10.1016/j.jclepro.2017.08.052
[27] 孙绩华, 冯健武, 段玮. 昆明城市热岛效应变化特征研究. 气候与环境研究, 2015, 20(6): 645-653. doi: 10.3878/j.issn.1006-9585.2015.15072 SUN J H, FENG J W, DUAN W. Change in the urban heat island effect in Kunming. Climatic and Environmental Research, 2015, 20(6): 645-653. doi: 10.3878/j.issn.1006-9585.2015.15072
[28] 李俊晓, 李朝奎, 殷智慧. 基于ArcGIS的克里金插值方法及其应用. 测绘通报, 2013(9): 87-90. LI J X, LI Z K, YIN Z H. The Kriging interpolation method based on ArcGIS and its application. Bulletin of Surveying and Mapping, 2013(9): 87-90.
[29] DALY C, HELMER E H, QUIONES M. Mapping the climate of Puerto Rico, Vieques and Culebra. International Journal of Climatology, 2003, 23(11): 1359-1381. doi: 10.1002/joc.937
[30] HASENAUER H, MERGANICOVA K, PETRITSCH R, PIETSCH S A, THORNTON P E. Validation daily climate interpolations over complex terrain in Austria. Agricultural & Forest Meteorology, 2003, 119(1-2): 8-107.
[31] 岳文泽, 吴次芳. 基于混合光谱分解的城市不透水面分布估算. 遥感学报, 2007, 11(6): 914-922. doi: 10.11834/jrs.200706123 YUE W F, WU C F. Urban impervious surface distribution estimation by spectral mixture analysis. National Remote Sensing Bulletin, 2007, 11(6): 914-922. doi: 10.11834/jrs.200706123
[32] YU X L, GUO X L, WU Z C. Land surface temperature retrieval from Landsat 8 TIRS: Comparison between radiative transfer equation-based method, split window algorithm and single channel method. Remote Sensing, 2014, 6(10): 9829-9852. doi: 10.3390/rs6109829
[33] YUAN F, BAUER M E. Comparison of impervious surface area and normalized difference vegetation index as indicators of surface urban heat island effects in Landsat imagery. Remote Sensing of Environment, 2007, 106(3): 375-386. doi: 10.1016/j.rse.2006.09.003
[34] LI J X, SONG C H, CAO L, ZHU F G, MENG X L, WU J G. Impacts of landscape structure on surface urban heat islands: A case study of Shanghai, China. Remote Sensing of Environment, 2011, 115(12): 3249-3263. doi: 10.1016/j.rse.2011.07.008
[35] 朱文泉, 潘耀忠, 张锦水. 中国陆地植被净初级生产力遥感估算. 植物生态学报, 2007, 31(3): 413-424. doi: 10.3321/j.issn:1005-264X.2007.03.010 ZHU W Q, PAN Y Z, ZHANG J S. Estimation of net primary productivity of Chinese terrestrial vegetation based on remote sensing. Chinese Journal of Plant Ecology, 2007, 31(3): 413-424. doi: 10.3321/j.issn:1005-264X.2007.03.010
[36] ICHII K, MATSUI Y, YAMAGUCHI Y, OGAWA K. Comparison of global net primary production trends obtained from satellite-based normalized difference vegetation index and carbon cycle model. Global Biogeochemical Cycles, 2001, 15(2): 351-363. doi: 10.1029/2000GB001296
[37] TOBLER W R. A computer movie simulating urban growth in the Detroit Region. Economic Geography, 1970, 46(sup1): 234-240.
[38] GOODCHILD M F. GIScience, geography, form, and process. Annals of the Association of American Geographers, 2004, 94: 709-714.
[39] LUO W, JASIEWICZ J, STEPINSKI T, PIETSCH S A, THORNTON P E. Spatial association between dissection density and environmental factors over the entire conterminous United States. Geophysical Research Letters, 2016, 43(2): 692-700. doi: 10.1002/2015GL066941
[40] XU Q, DONG Y X, WANG Y Y, YANG R, XU C D. Determinants and identification of the northern boundary of China’s tropical zone. Journal of Geographical Sciences, 2018, 28(1): 31-45. doi: 10.1007/s11442-018-1457-1
[41] 王劲峰, 徐成东. 地理探测器: 原理与展望. 地理学报, 2017, 72(1): 116-134. doi: 10.11821/dlxb201701010 WANG J F, XU C D. Geodetector: Principle and prospective. Acta Geographical Sinica, 2017, 72(1): 116-134. doi: 10.11821/dlxb201701010
[42] FOTHERINGHAM A S, CHARLTON M, BRUNSDON C. The geography of parameter space: An investigation into spatial non-stationarity. International Journal of Geographical Information Systems, 1996, 10(5): 605-627. doi: 10.1080/02693799608902100
[43] 王新闯, 王世东, 张合兵. 基于MOD17A3的河南省NPP时空格局. 生态学杂志, 2013(10): 2797-2805. WANG X C, WANG S D, ZHANG H B. Spatiotemporal pattern of vegetation net primary productivity in Henan Province of China based on MOD17A3. Chinese Journal of Ecology, 2013(10): 2797-2805.
[44] REN Q, HE C Y, HUANG Q X, SHI P J, ZHANG D, GÜNERALP B. Impacts of urban expansion on natural habitats in global drylands. Nature Sustainability, 2022, 5: 869-878. doi: 10.1038/s41893-022-00930-8
[45] ZHANG L, YANG L, ZOHNER C M, CROWTHER T W, LI M C, SHEN F X, GUO M, QIN J, YAO L, ZHOU C H. Direct and indirect impacts of urbanization on vegetation growth across the world’s cities. Science Advances, 2022, 8(27): 95. doi: 10.1126/sciadv.abo0095
-
![]()
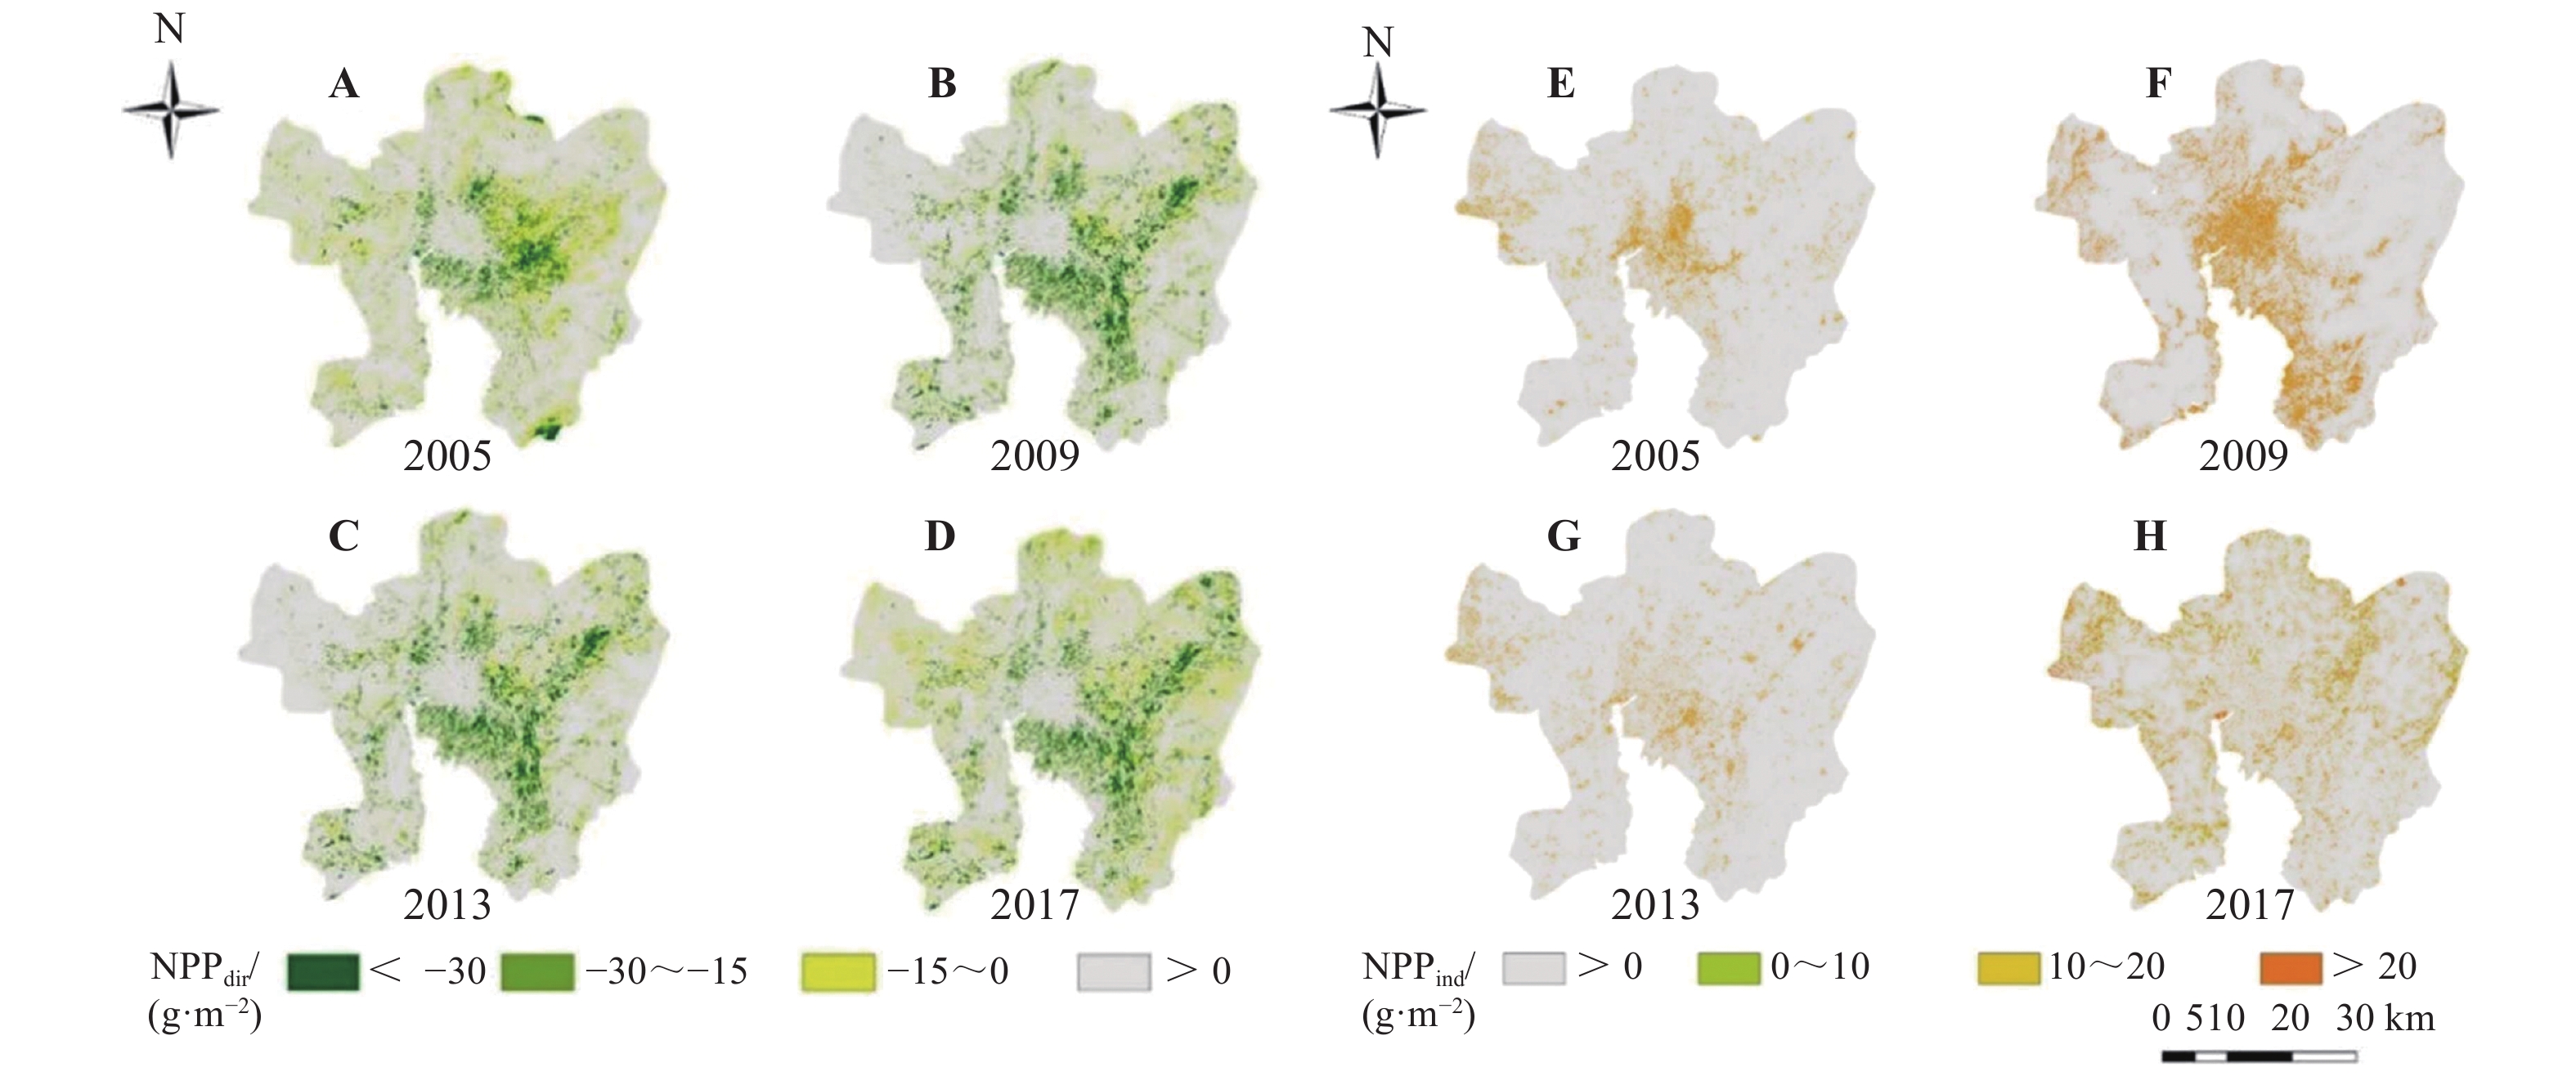
图 3 昆明市城市化对净初级生产力的直接影响(NPPdir)和间接影响(NPPind)分布图
Figure 3. Distribution map of the direct (NPPdir) and indirect (NPPind) effects of urbanization on net primary productivity (NPP) in Kunming City
![]()
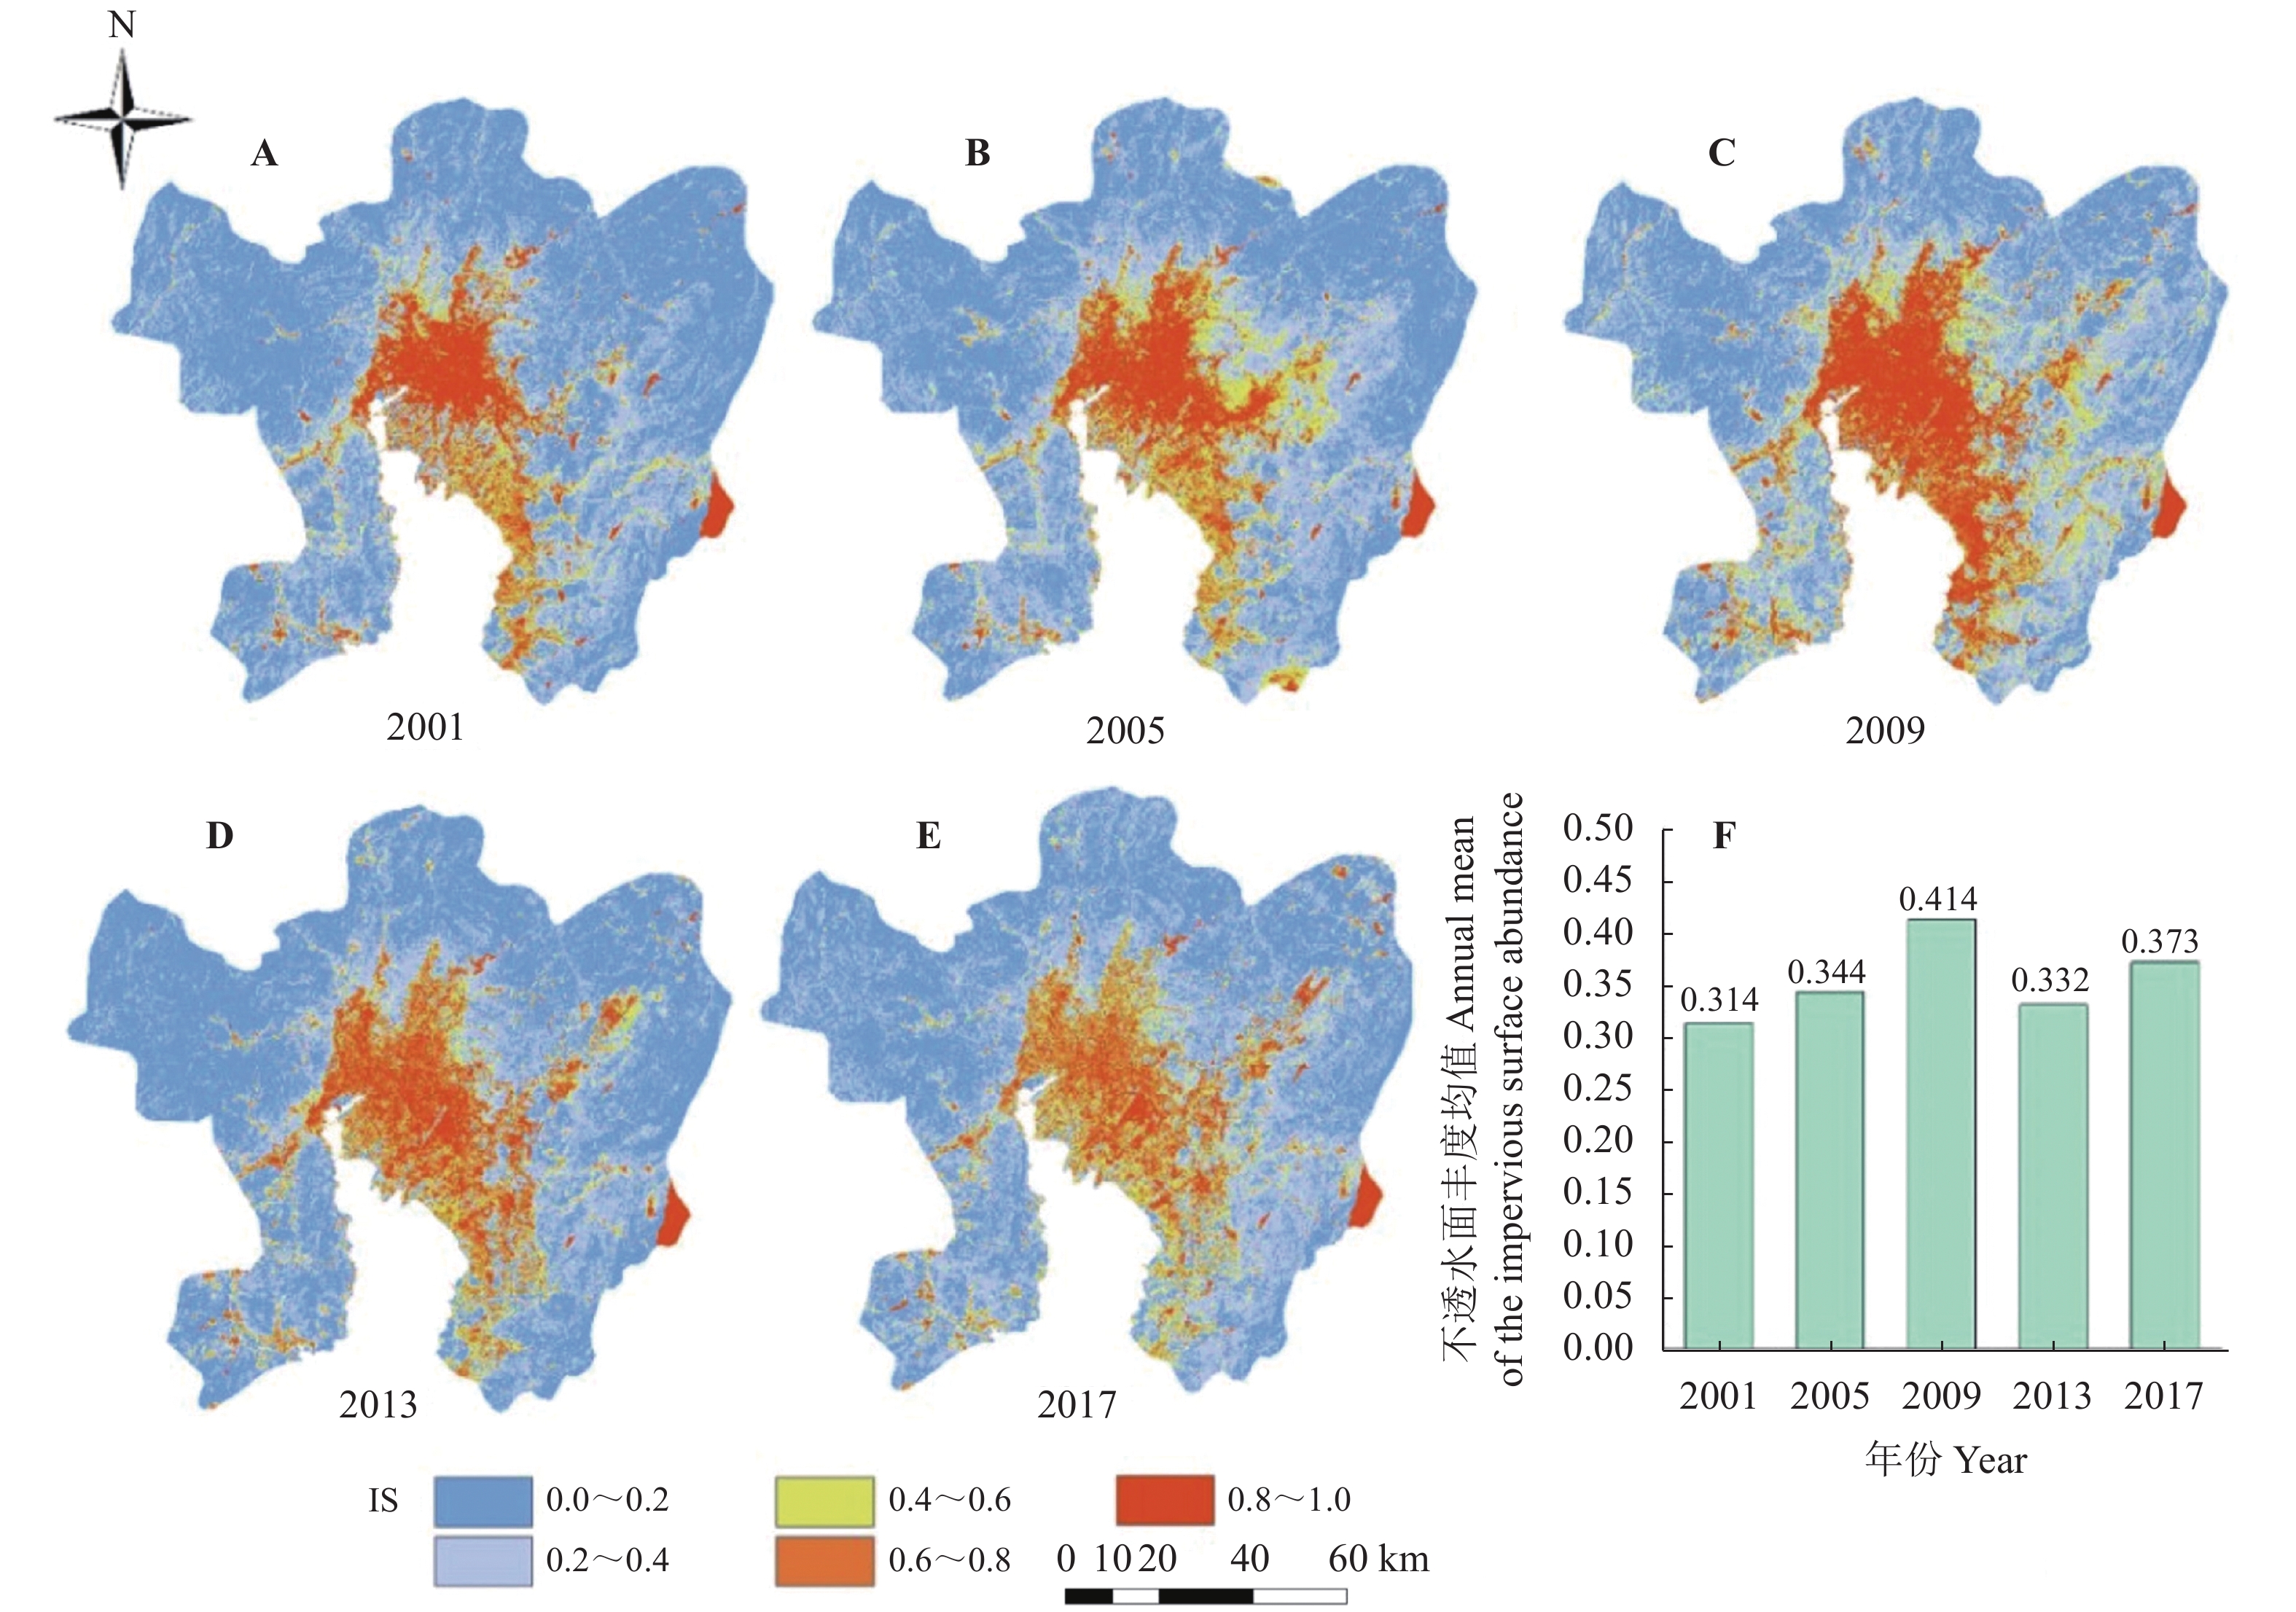
图 4 昆明市不透水面丰度分布图
Figure 4. Distribution maps of the impervious surface abundance (IS) in Kunming
![]()
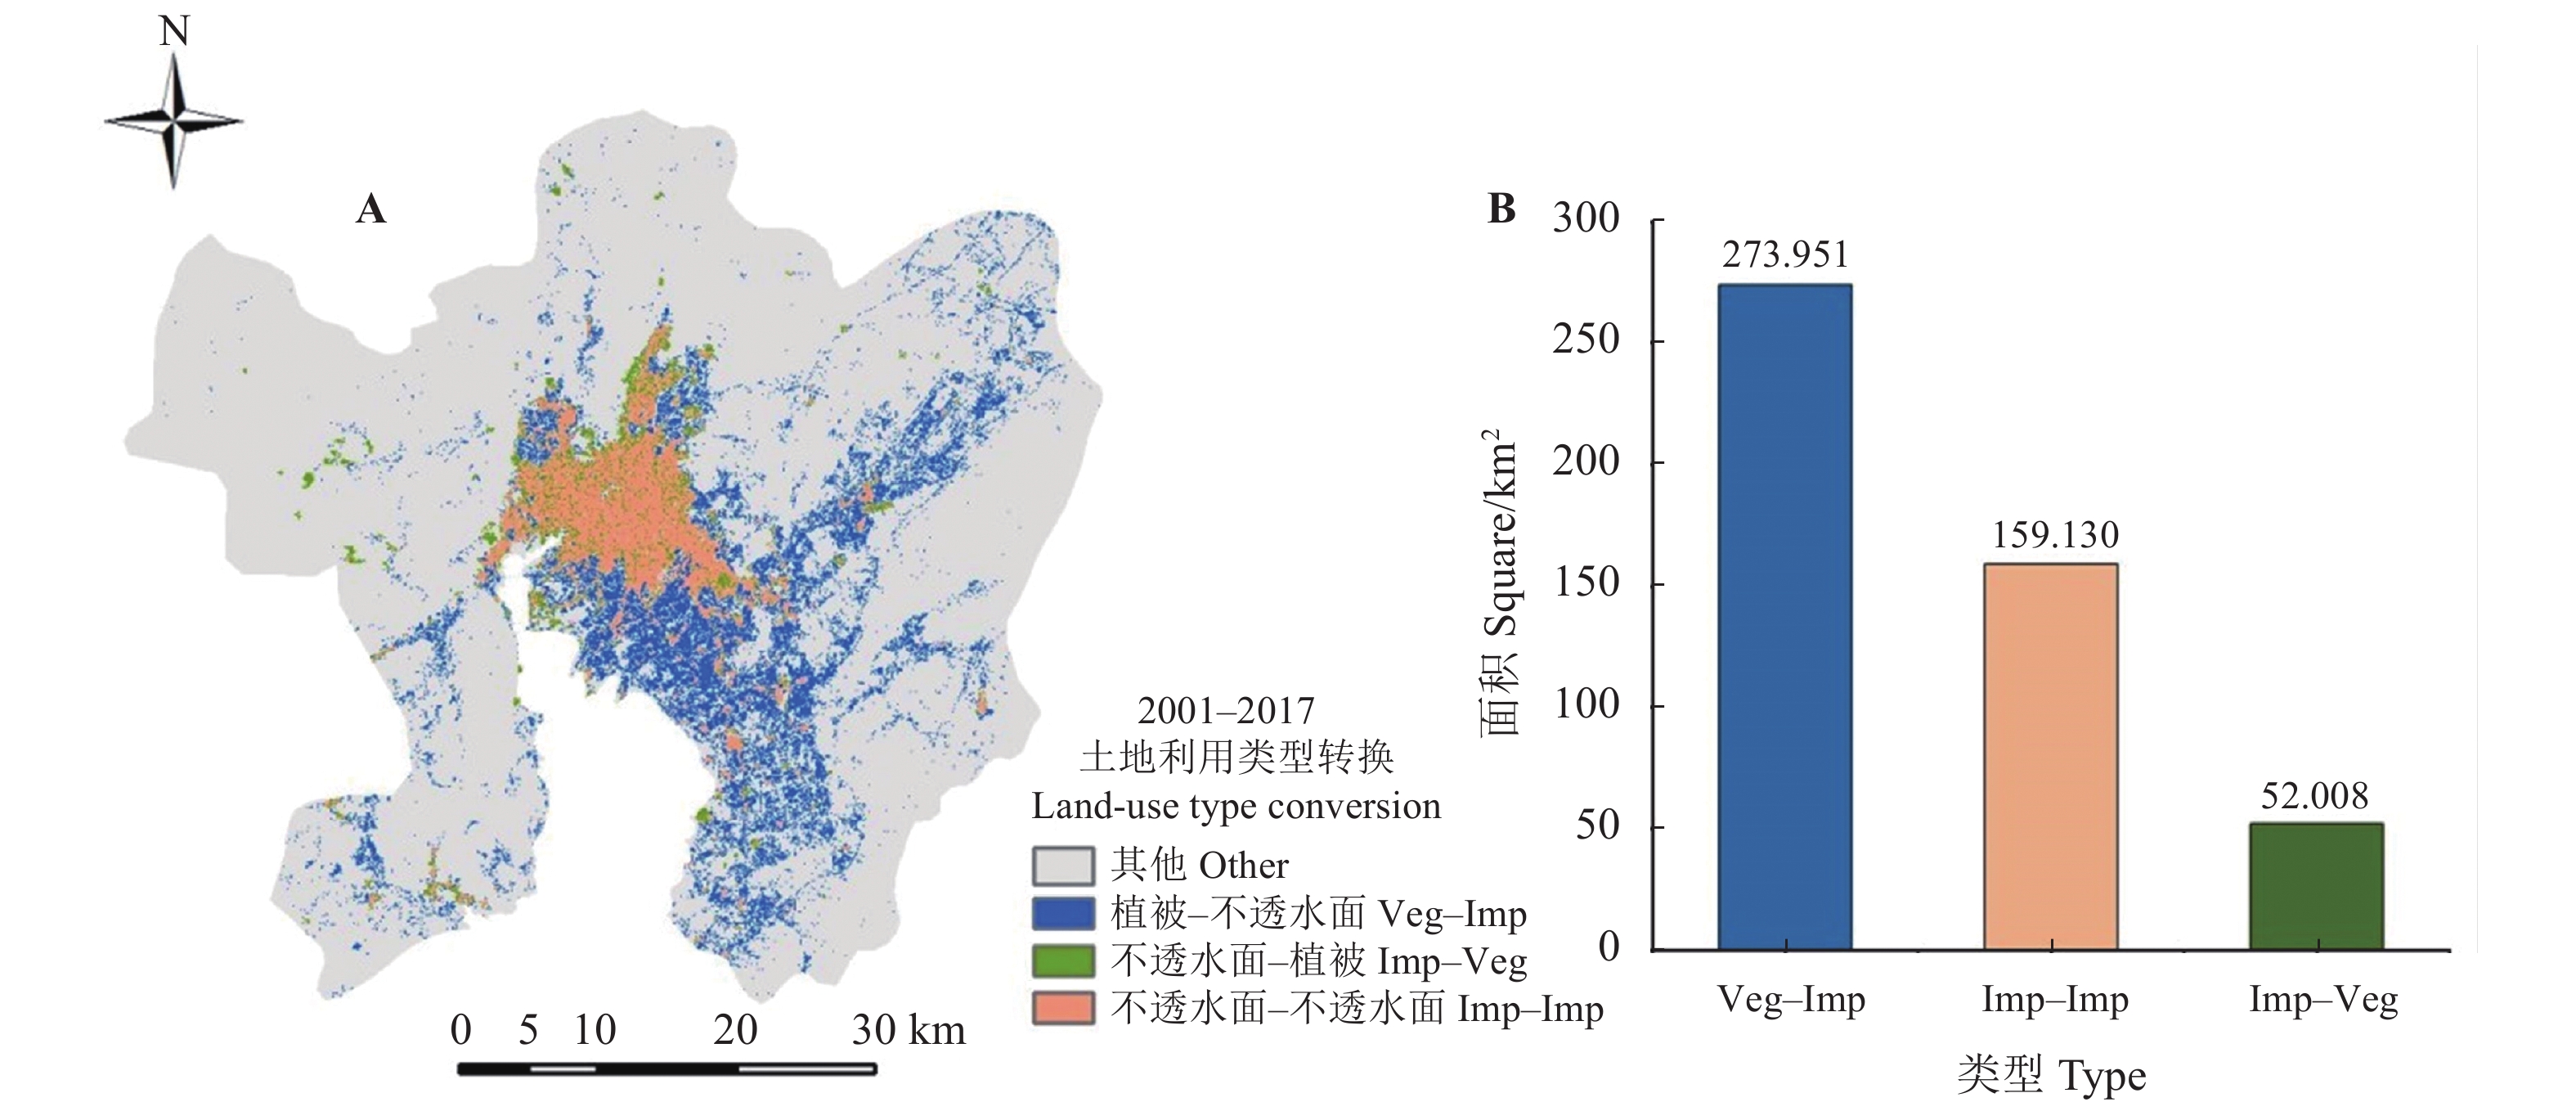
图 5 昆明市2001-2017年不同土地覆盖变化类型的空间分布(A)与土地利用转换类型所占面积(B)
Figure 5. The spatial distribution of different types of land cover change in Kunming from 2001 to 2017 (A) and the percentage of each type of land use conversion (B)
Veg–Imp: vegetation–impervious surface; Imp–Imp: impervious surface–impervious surface; Imp–Veg: impervious surface–vegetation.
![]()
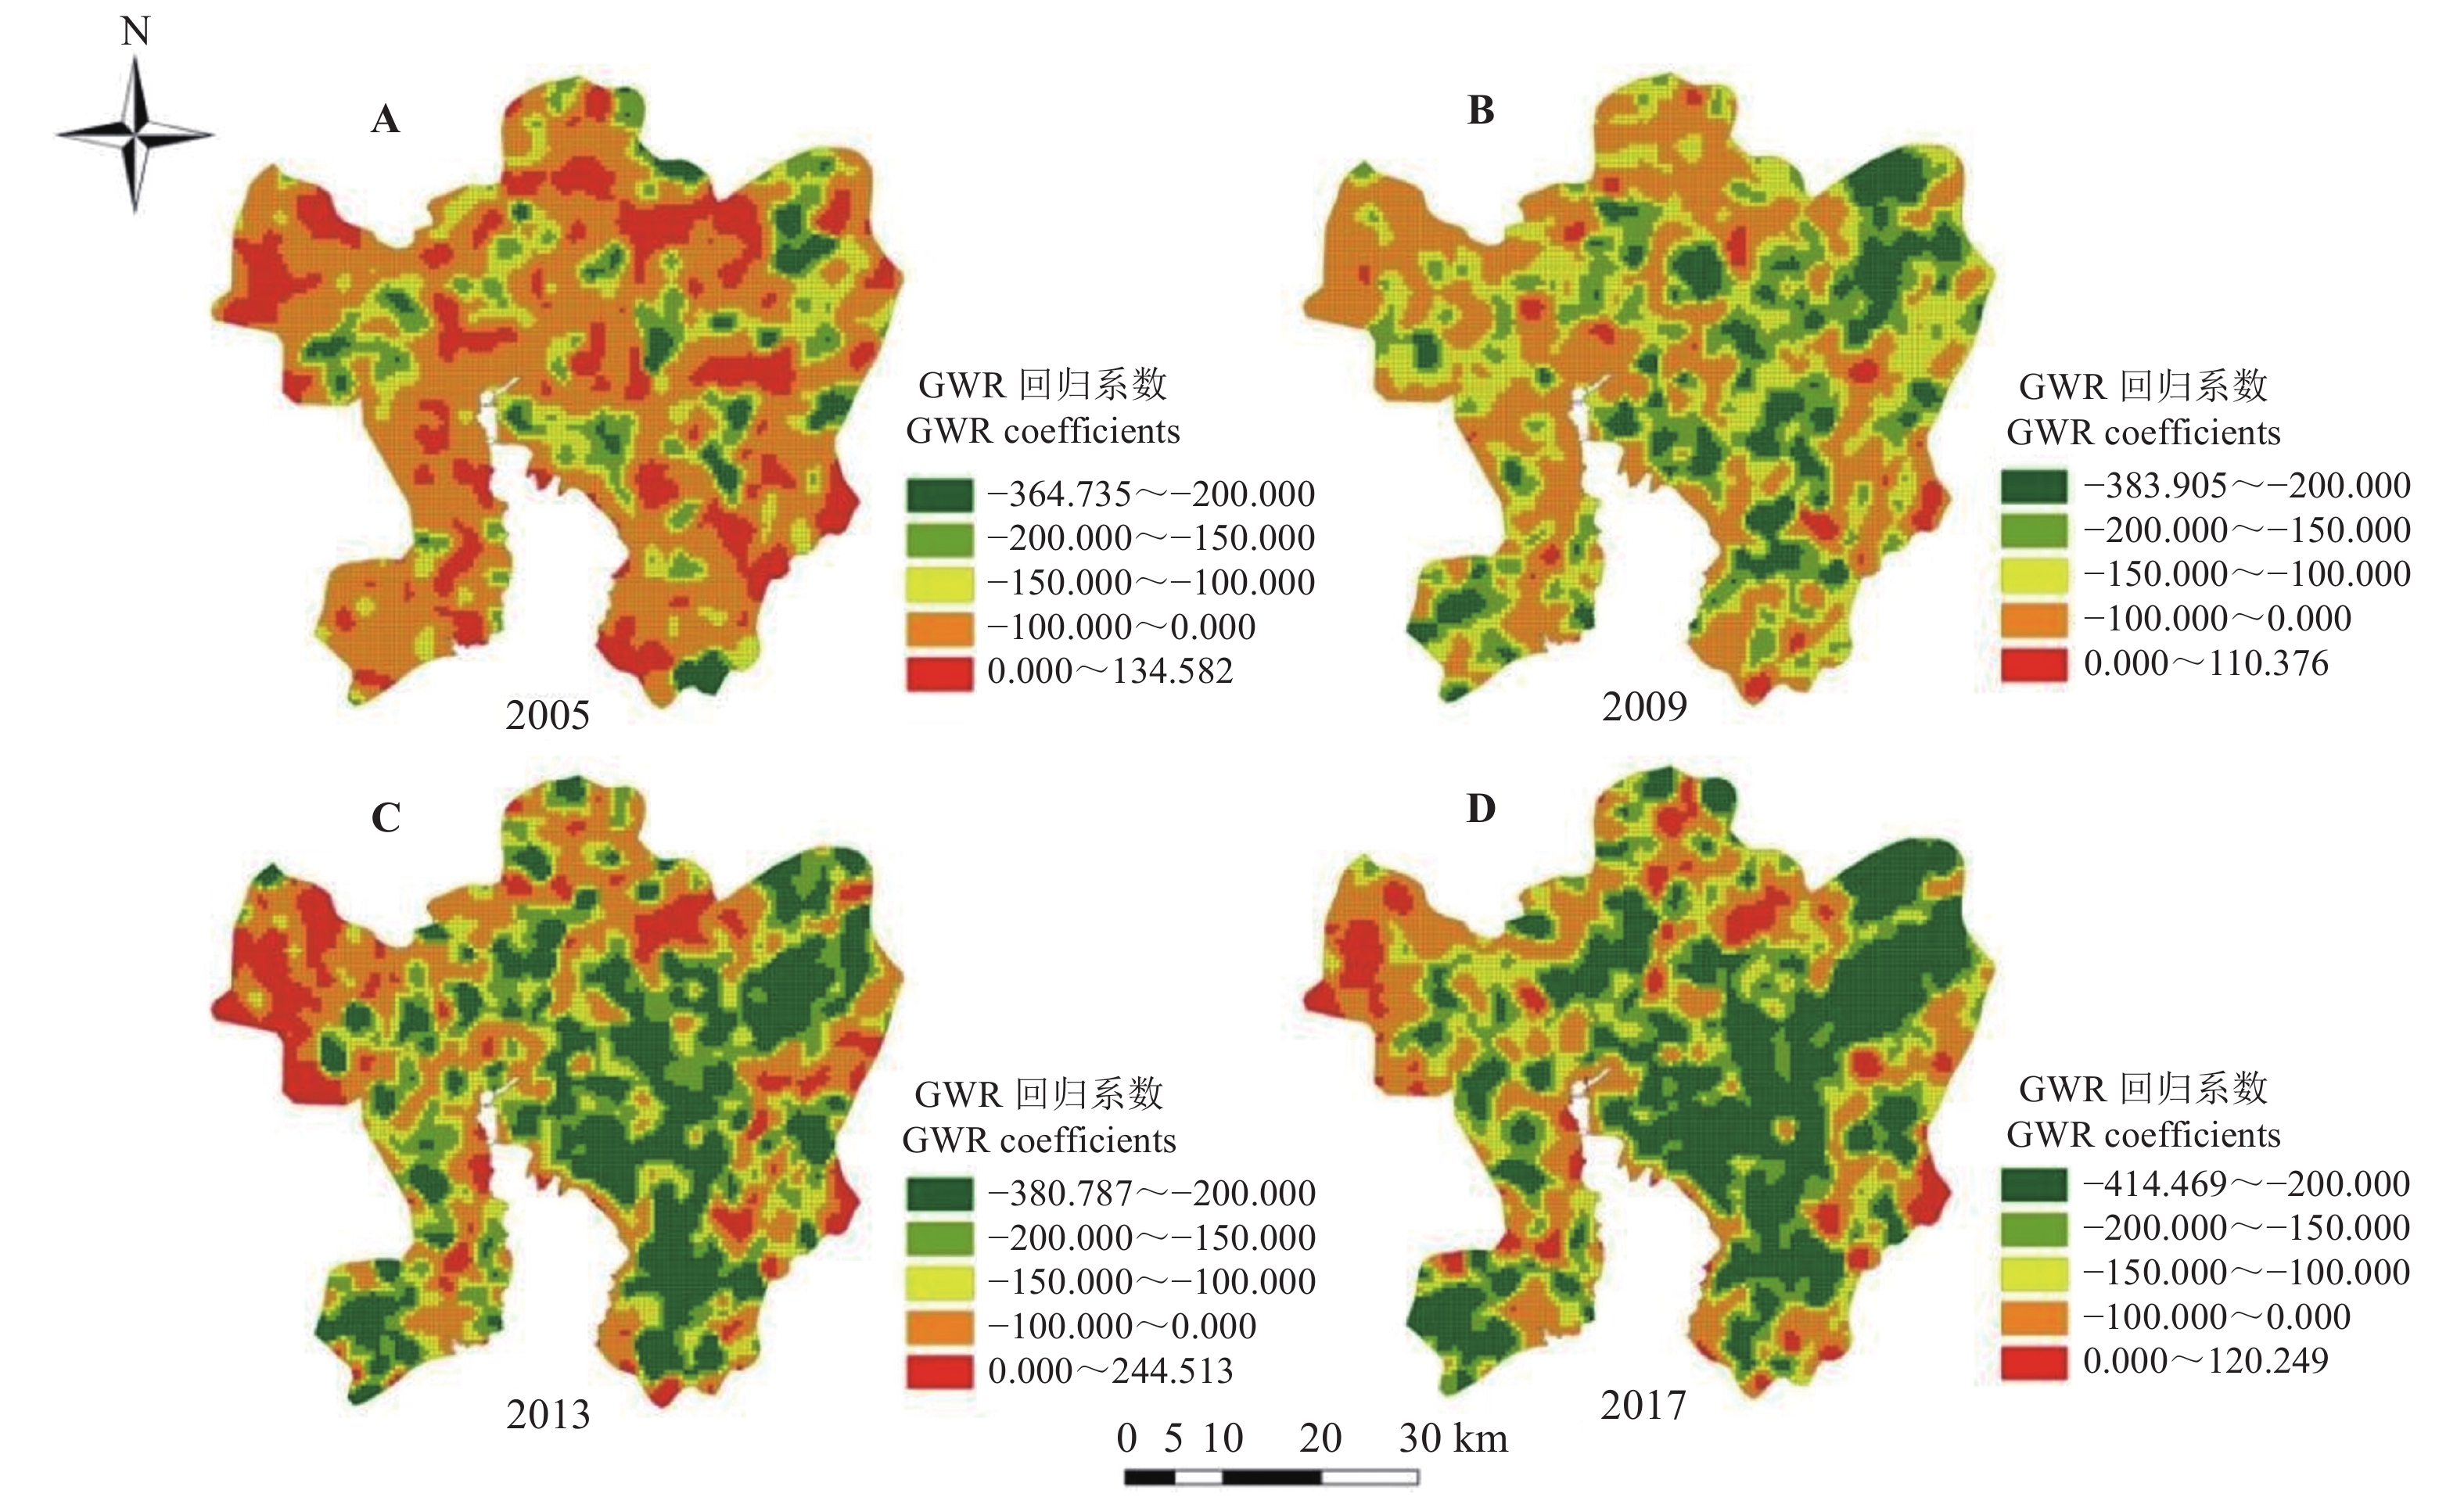
图 7 昆明市不透水面丰度对直接NPP地理加权回归系数分布
Figure 7. Distribution maps of GWR coefficients of IS to NPPdir in Kunming
![]()
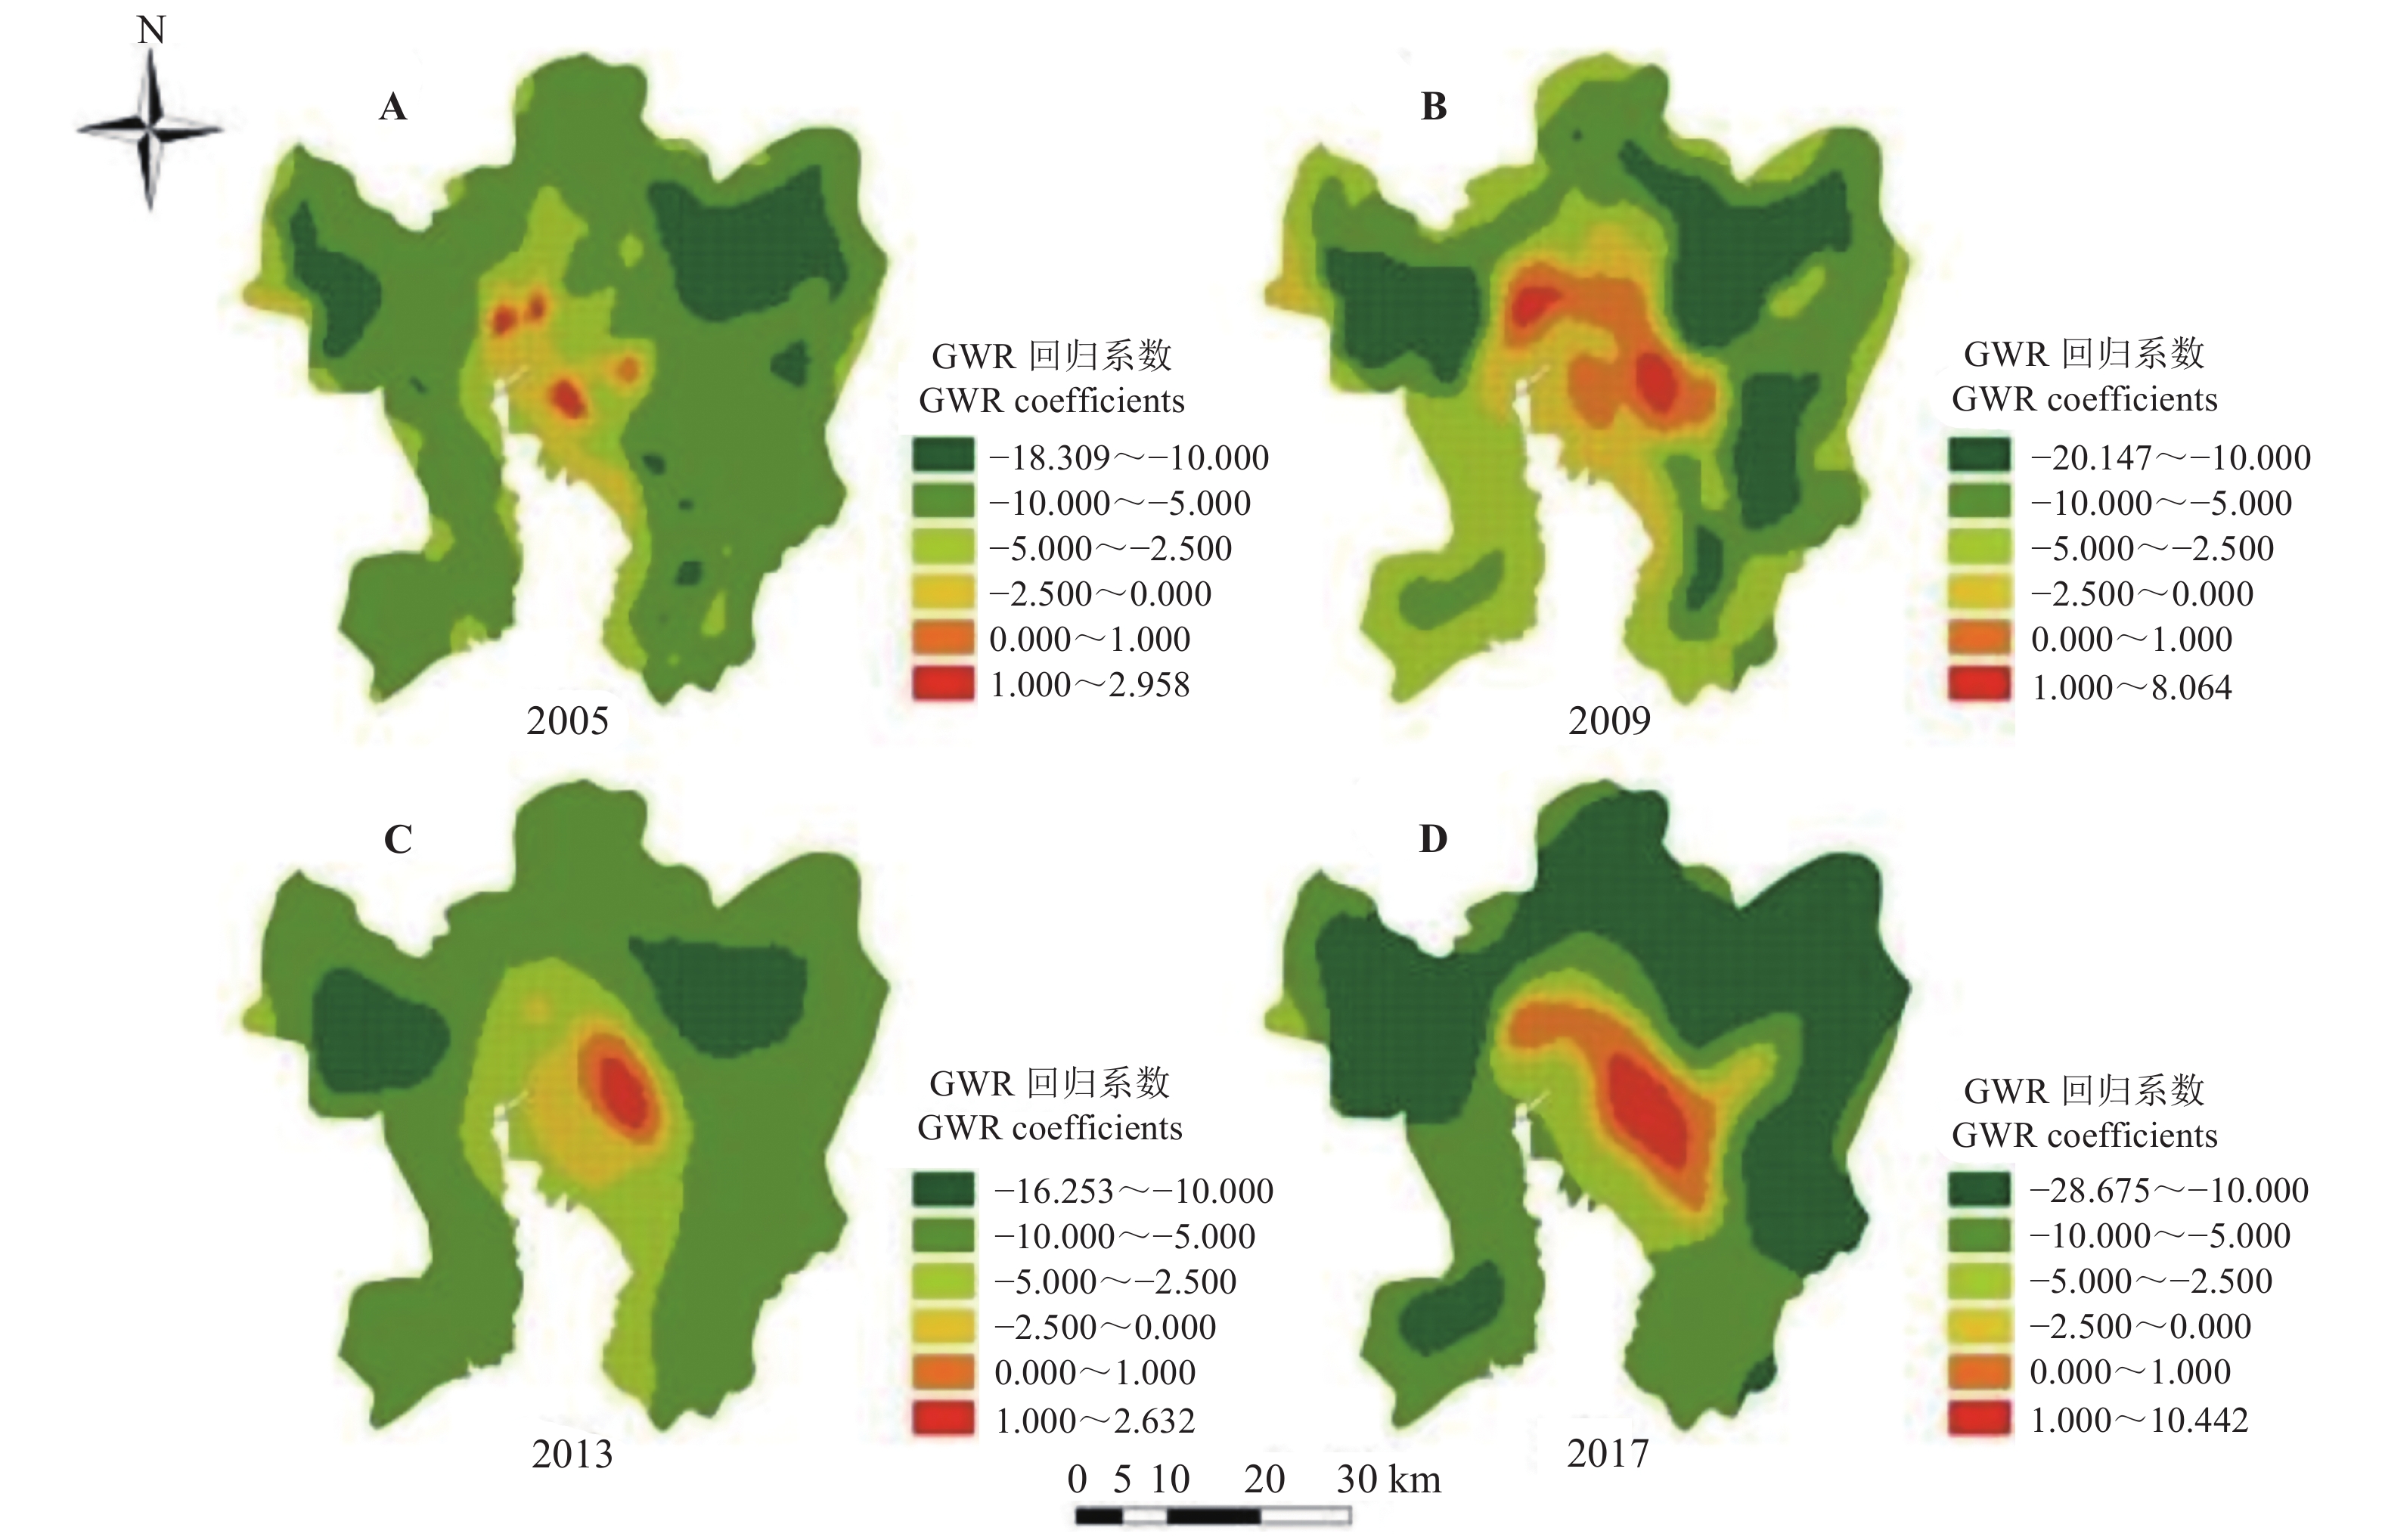
图 8 昆明市地表温度对间接NPP地理加权回归系数分布
Figure 8. Distribution maps of GWR coefficients of LST to NPPind in Kunming
![]()
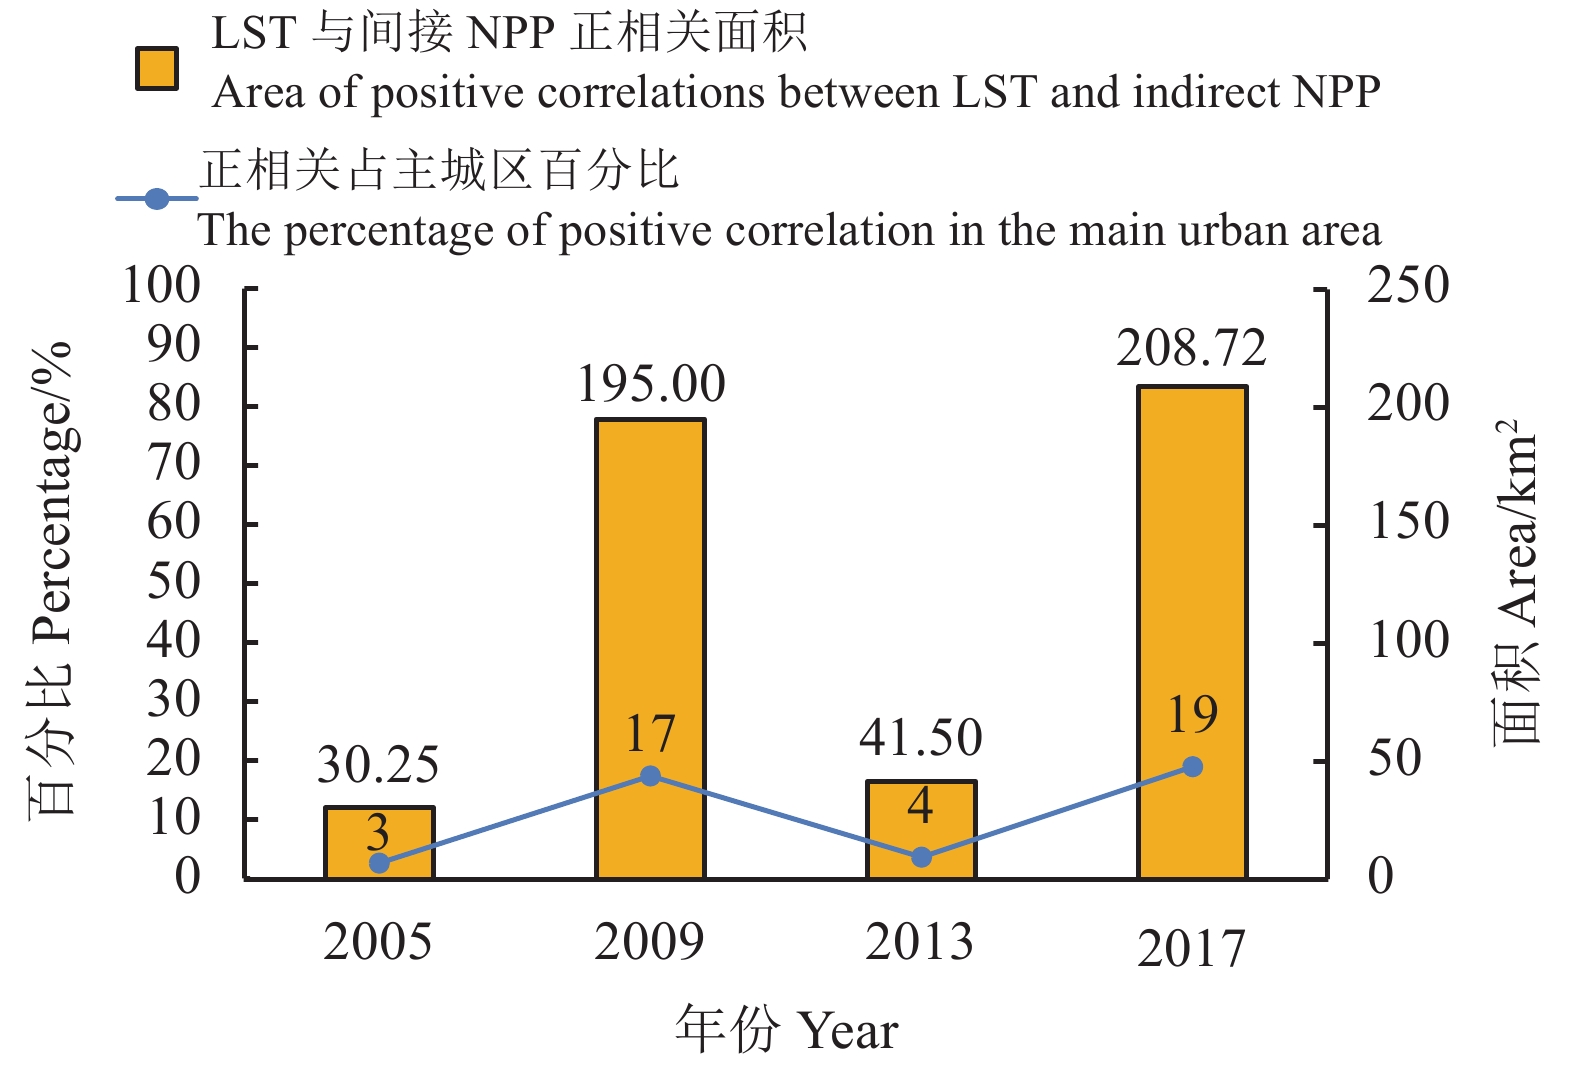
图 9 昆明市地表温度对间接NPP地理加权回归正相关系数占主城区百分比及面积
Figure 9. Percentage of positive GWR correlation coefficients and the effect of LST on NPPind in the urban area of Kunming
表 1 研究数据来源
Table 1 The sources of research data
数据类型
Data type数据
Data时间
Time分辨率
Spatial resolution/m来源
Source遥感数据
Remote sensing dataLandsat5,8 2001
2005
2009
2013
201730 地理空间数据云
Geospatial data cloudMCD12Q1土地利用
Land use500 NASA官网
NASA official websiteMOD17A3 500 气象数据
Meteorological data平均气温、降水
Temperature, precipitation2001
2005
2009
2013
2017− 国家气象科学数据中心
The National Meteorological Science Data Center太阳辐射
Solar radiation− 国家青藏高原科学数据中心
The National Qinghai-Tibet Plateau
Scientific Data Center其他数据
Other dataFROM-GLC土地利用分类
Land use classification2017 10 http://www.globallandcover.com GlobeLand30土地利用分类
Land use classification2000 30 http://data.ess.tsinghua.edu.cn/ 数字高程模型
Digital elevation model− 30 NASA官网
NASA official website研究区矢量数据
Study area vector data2018 − GADM数据库
Database 下载: 导出CSV
表 2 Landsat遥感影像信息
Table 2 Landsat image information
成像日期
Imaging date/(YYYY-MM-DD)轨道号
Track number传感器
Sensor用途
Application2001-04-03 129/043 Landsat TM 反演NDVI Reverse NDVI
反演不透水面丰度
Reverse the impervious surface abundance
反演地表温度 Reverse surface temperature2005-04-30 129/043 Landsat TM 2009-04-09 129/043 Landsat TM 2013-04-20 129/043 Landsat OLI 2017-05-01 129/043 Landsat OLI
下载: 导出CSV
表 3 全局莫兰指数
Table 3 The Globle Moran’s Index (GMI)
年份
Year植被净初级生产力
Net primary productivity
vegetation NPP-GMI直接NPP
Direct NPP
NPPdir-GMI间接NPP
Indirect NPP
NPPind-GMI地表温度
Land surface
temperature LST-GMI不透水面丰度
Impervious surface
abundance IS-GMI2001 0.512 – – 0.335 0.584 2005 0.502 0.233 0.405 0.382 0.655 2009 0.499 0.190 0.398 0.320 0.599 2013 0.457 0.200 0.353 0.332 0.588 2017 0.467 0.210 0.291 0.359 0.519
下载: 导出CSV
表 4 IS与LST对NPP的交互探测结果
Table 4 The interaction results for IS and LST with NPP
年份
YearIS解释力
Explanatory power
q (IS)LST解释力
Explanatory power
q (LST)二者共同解释力
Interactive explanatory
power q (IS∩LST)交互作用
Interaction2001 0.344 0.123 0.485 非线性增强
Nonlinear enhancement2005 0.260 0.193 0.513 非线性增强
Nonlinear enhancement2009 0.238 0.168 0.408 非线性增强
Nonlinear enhancement2013 0.375 0.130 0.468 双因子增强
Bivariate enhancement2017 0.399 0.254 0.521 双因子增强
Bivariate enhancement以上q值均通过显著性检验(P < 0.001)。
All q values passed the significance test (P < 0.001).
下载: 导出CSV
表 5 最小二乘法回归系数
Table 5 The ordinary least square regression coefficients
年份 Year IS-NPPdir LST-NPPind P 2005 −41.276 −5.638 0.001 2009 −79.817 −5.325 0.001 2013 −83.111 −5.970 0.001 2017 −78.702 −4.925 0.001
下载: 导出CSV
表 6 OLS与GWR模型拟合度对比
Table 6 The comparison of model fits between OLS and GWR
年份
Year参数
ParametersIS对直接NPP的
OLS拟合度
OLS_IS-NPPdirIS对直接NPP的
GWR拟合度
GWR_IS-GWRLST对间接NPP的
OLS拟合度
OLS_LST-OLSLST对间接NPP的
GWR拟合度
GWR_LST-GWR2005 Adjusted R2 0.582 0.643 0.358 0.613 AIC 111 550.679 108 338.964 121 419.537 116 146.886 2009 Adjusted R2 0.219 0.463 0.200 0.541 AIC 112 523.222 109 292.109 124 905.137 119 019.784 2013 Adjusted R2 0.150 0.484 0.314 0.520 AIC 116 395.342 111 891.572 122 807.178 118 971.067 2017 Adjusted R2 0.100 0.496 0.251 0.471 AIC 118 076.220 112 927.655 131 065.518 127 378.100 AIC:赤池信息量准则。
AIC: Akaike information criterion.
下载: 导出CSV
-
[1] IMHOFF M L, BOUNOUA L, DEFRIES R, LAERENCE W T, STUTZER D, TUCKER C J, RICHETTS T. The consequences of urban land transformation on net primary productivity in the United States. Remote Sensing of Environment, 2004, 89(4): 434-443. doi: 10.1016/j.rse.2003.10.015
[2] TIAN G J, QIAO Z. Assessing the impact of the urbanization process on net primary productivity in China in 1989–2000. Environmental Pollution, 2014, 184: 320-326. doi: 10.1016/j.envpol.2013.09.012
[3] WU S H, ZHOU S L, CHEN D X, WEI Z Q, DAI L, LI X G. Determining the contributions of urbanization and climate change to NPP variations over the last decade in the Yangtze River Delta, China. Science of The Total Environment, 2014, 472: 397-406. doi: 10.1016/j.scitotenv.2013.10.128
[4] VITOUSEK P M, MOONEY H A, LUBCHENCO J, MELILLO J M. Human domination of Earth’s ecosystems. Science, 2008, 277: 494-499.
[5] GREGG J W, JONES C G, DAWSON T E. Urbanization effects on tree growth in the vicinity of New York City. Nature, 2003, 424: 183-187. doi: 10.1038/nature01728
[6] CARREIRO M M, TRIPLER C E. Forest remnants along urban-rural gradients: Examining their potential for global change research. Ecosystems, 2005, 8(5): 568-582. doi: 10.1007/s10021-003-0172-6
[7] ZHOU D C, ZHAO S Q, ZHANG L X, LIU S G. Remotely sensed assessment of urbanization effects on vegetation phenology in China’s 32 major cities. Remote Sensing of Environment, 2016, 176: 272-281. doi: 10.1016/j.rse.2016.02.010
[8] YAN Y C, LIU X P, WANG F Y, LI X, OU J P, WEN Y Y, LIANG X. Assessing the impacts of urban sprawl on net primary productivity using fusion of Landsat and MODIS data. Science of The Total Environment, 2018, 613: 1417-1429.
[9] OKE T R. The micrometeorology of the urban forest. Philosophical Transactions of the Royal Society B: Biological Sciences, 1989, 324: 335-349.
[10] POTTER C S, RANDERSON J T, FIELD C B, MATSON P A, KLOOSTER S A. Terrestrial eco-system production: A process model based on global satellite and surface data. Global Biogeochemical Cycles, 1993, 7(4): 811-841. doi: 10.1029/93GB02725
[11] HARDIMAN B S, WANG J A, HUTYRA L R, GATELY C K, GETSON J M, FRIED M A. Accounting for urban biogenic fluxes in regional carbon budgets. Remote Sensing of Environment, 2017, 592: 366-372.
[12] FIELD C B, BEHRENFELD M J, RANDERSON J T, FALKOWSKI P. Primary production of the biosphere: integrating terrestrial and oceanic components. Science, 1998, 281: 237-240. doi: 10.1126/science.281.5374.237
[13] PIAO S L, FANG J Y, ZHOU L M, ZHU B, TAN K, TAO S. Changes in vegetation net primary productivity from 1982 to 1999 in China. Global Biogeochem Cycles, 2005, 19(2): 183-196.
[14] FANG Y, LI J, QING H. Quantitative assessment of the human appropriation of net primary production (HANPP) in the coastal areas of Jiangsu, China. Sustainability, 2015, 7(12): 15857-15870. doi: 10.3390/su71215793
[15] PIAO S L, FANG J Y, HE J S. Variations in vegetation net primary production in the Qinghai-Xizang Plateau, China, from 1982 to 1999. Climate Change, 2006, 74(1): 253-267.
[16] TIAN Y H, HUANG W L, WU X C, JIM C Y, LIU Y Q. Dominant control of climate variations over land-use change on net primary productivity under different urbanization intensities in Beijing, China. Acta Ecologica Sinica, 2019, 39(5): 416-424. doi: 10.1016/j.chnaes.2019.07.002
[17] ZHAO S Q, LIU S G, ZHOU D C. Prevalent vegetation growth enhancement in urban environment. Proceedings of the National Academy of Sciences of the United States of America, 2016, 113(22): 6313-6318. doi: 10.1073/pnas.1602312113
[18] GUAN X B, SHEN H F, LI X H, GAN W X, ZHANG L P. A long-term and comprehensive assessment of the urbanization-induced impacts on vegetation net primary productivity. Science of The Total Environment, 2019, 669: 342-352. doi: 10.1016/j.scitotenv.2019.02.361
[19] BUYANTUYEV A, WU J. Urbanization alters spatiotemporal patterns of ecosystem primary production: A case study of the Phoenix metropolitan region, USA. Journal of Arid Environments, 2009, 73 (4–5): 512-520.
[20] JIA W X, ZHAO S Q, LIU S G. Vegetation growth enhancement in urban environments of the conterminous United States. Global Change Biology, 2018, 24(9): 4084-4094. doi: 10.1111/gcb.14317
[21] ZHONG J, LIU J F, JIAO L M, LIAN X H, XU Z B, ZHOU Z Z. Assessing the comprehensive impacts of different urbanization process on vegetation net primary productivity in Wuhan, China, from 1990 to 2020. Sustainable Cities and Society, 2021, 75: 103295. doi: 10.1016/j.scs.2021.103295
[22] LU X Y, CHEN X, ZHAO X L, LYU D J, ZHANG Y. Assessing the impact of land surface temperature on urban net primary productivity increment based on geographically weighted regression model. Scientific Reports, 2021, 11: 22282. doi: 10.1038/s41598-021-01757-7
[23] WANG S J, SHI C Y, FANG C L, FENG K S. Examining the spatial variations of determinants of energy-related CO2 emissions in China at the city level using Geographically Weighted Regression Model. Applied Energy, 2019, 235: 95-105. doi: 10.1016/j.apenergy.2018.10.083
[24] FOTHERINGHAM A S, BRUNSDON C, CHARLTON M. Geographically weighted regression: The analysis of spatially varying relationships. American Journal of Agricultural Economics, 2004, 86(2): 554-556. doi: 10.1111/j.0002-9092.2004.600_2.x
[25] KASHKI A, KARAMI M, ZANDI R, ROKI R. Evaluation of the effect of geographical parameters on the formation of the land surface temperature by applying OLS and GWR, A case study Shiraz City, Iran. Urban Climate, 2021, 37: 100832. doi: 10.1016/j.uclim.2021.100832
[26] XU B, XU L, XU R J, LUO L Q. Geographical analysis of CO2 emissions in China’s manufacturing industry: A geographically weighted regression model. Journal of Cleaner Production, 2017, 166: 628-640. doi: 10.1016/j.jclepro.2017.08.052
[27] 孙绩华, 冯健武, 段玮. 昆明城市热岛效应变化特征研究. 气候与环境研究, 2015, 20(6): 645-653. doi: 10.3878/j.issn.1006-9585.2015.15072 SUN J H, FENG J W, DUAN W. Change in the urban heat island effect in Kunming. Climatic and Environmental Research, 2015, 20(6): 645-653. doi: 10.3878/j.issn.1006-9585.2015.15072
[28] 李俊晓, 李朝奎, 殷智慧. 基于ArcGIS的克里金插值方法及其应用. 测绘通报, 2013(9): 87-90. LI J X, LI Z K, YIN Z H. The Kriging interpolation method based on ArcGIS and its application. Bulletin of Surveying and Mapping, 2013(9): 87-90.
[29] DALY C, HELMER E H, QUIONES M. Mapping the climate of Puerto Rico, Vieques and Culebra. International Journal of Climatology, 2003, 23(11): 1359-1381. doi: 10.1002/joc.937
[30] HASENAUER H, MERGANICOVA K, PETRITSCH R, PIETSCH S A, THORNTON P E. Validation daily climate interpolations over complex terrain in Austria. Agricultural & Forest Meteorology, 2003, 119(1-2): 8-107.
[31] 岳文泽, 吴次芳. 基于混合光谱分解的城市不透水面分布估算. 遥感学报, 2007, 11(6): 914-922. doi: 10.11834/jrs.200706123 YUE W F, WU C F. Urban impervious surface distribution estimation by spectral mixture analysis. National Remote Sensing Bulletin, 2007, 11(6): 914-922. doi: 10.11834/jrs.200706123
[32] YU X L, GUO X L, WU Z C. Land surface temperature retrieval from Landsat 8 TIRS: Comparison between radiative transfer equation-based method, split window algorithm and single channel method. Remote Sensing, 2014, 6(10): 9829-9852. doi: 10.3390/rs6109829
[33] YUAN F, BAUER M E. Comparison of impervious surface area and normalized difference vegetation index as indicators of surface urban heat island effects in Landsat imagery. Remote Sensing of Environment, 2007, 106(3): 375-386. doi: 10.1016/j.rse.2006.09.003
[34] LI J X, SONG C H, CAO L, ZHU F G, MENG X L, WU J G. Impacts of landscape structure on surface urban heat islands: A case study of Shanghai, China. Remote Sensing of Environment, 2011, 115(12): 3249-3263. doi: 10.1016/j.rse.2011.07.008
[35] 朱文泉, 潘耀忠, 张锦水. 中国陆地植被净初级生产力遥感估算. 植物生态学报, 2007, 31(3): 413-424. doi: 10.3321/j.issn:1005-264X.2007.03.010 ZHU W Q, PAN Y Z, ZHANG J S. Estimation of net primary productivity of Chinese terrestrial vegetation based on remote sensing. Chinese Journal of Plant Ecology, 2007, 31(3): 413-424. doi: 10.3321/j.issn:1005-264X.2007.03.010
[36] ICHII K, MATSUI Y, YAMAGUCHI Y, OGAWA K. Comparison of global net primary production trends obtained from satellite-based normalized difference vegetation index and carbon cycle model. Global Biogeochemical Cycles, 2001, 15(2): 351-363. doi: 10.1029/2000GB001296
[37] TOBLER W R. A computer movie simulating urban growth in the Detroit Region. Economic Geography, 1970, 46(sup1): 234-240.
[38] GOODCHILD M F. GIScience, geography, form, and process. Annals of the Association of American Geographers, 2004, 94: 709-714.
[39] LUO W, JASIEWICZ J, STEPINSKI T, PIETSCH S A, THORNTON P E. Spatial association between dissection density and environmental factors over the entire conterminous United States. Geophysical Research Letters, 2016, 43(2): 692-700. doi: 10.1002/2015GL066941
[40] XU Q, DONG Y X, WANG Y Y, YANG R, XU C D. Determinants and identification of the northern boundary of China’s tropical zone. Journal of Geographical Sciences, 2018, 28(1): 31-45. doi: 10.1007/s11442-018-1457-1
[41] 王劲峰, 徐成东. 地理探测器: 原理与展望. 地理学报, 2017, 72(1): 116-134. doi: 10.11821/dlxb201701010 WANG J F, XU C D. Geodetector: Principle and prospective. Acta Geographical Sinica, 2017, 72(1): 116-134. doi: 10.11821/dlxb201701010
[42] FOTHERINGHAM A S, CHARLTON M, BRUNSDON C. The geography of parameter space: An investigation into spatial non-stationarity. International Journal of Geographical Information Systems, 1996, 10(5): 605-627. doi: 10.1080/02693799608902100
[43] 王新闯, 王世东, 张合兵. 基于MOD17A3的河南省NPP时空格局. 生态学杂志, 2013(10): 2797-2805. WANG X C, WANG S D, ZHANG H B. Spatiotemporal pattern of vegetation net primary productivity in Henan Province of China based on MOD17A3. Chinese Journal of Ecology, 2013(10): 2797-2805.
[44] REN Q, HE C Y, HUANG Q X, SHI P J, ZHANG D, GÜNERALP B. Impacts of urban expansion on natural habitats in global drylands. Nature Sustainability, 2022, 5: 869-878. doi: 10.1038/s41893-022-00930-8
[45] ZHANG L, YANG L, ZOHNER C M, CROWTHER T W, LI M C, SHEN F X, GUO M, QIN J, YAO L, ZHOU C H. Direct and indirect impacts of urbanization on vegetation growth across the world’s cities. Science Advances, 2022, 8(27): 95. doi: 10.1126/sciadv.abo0095
计量
- PDF下载量: 18
- 文章访问数: 505
- HTML全文浏览量: 166